By the end of year 6
Number and algebra | Geometry and measurement | Statistics
The following problems and descriptions of student thinking exemplify what is required to meet this standard.
Number and algebra
In contexts that require them to solve problems or model situations, students will be able to:
-
apply additive and simple multiplicative strategies flexibly to:
- combine or partition whole numbers, including performing mixed operations and using addition and subtraction as inverse operations
- find fractions of sets, shapes, and quantities
- determine members of sequential patterns, given their ordinal positions
-
describe spatial and number patterns, using:
- tables and graphs
- rules that involve spatial features, repeated addition or subtraction, and simple multiplication.
During this school year, ‘number’ should be the focus of 50–70 percent of mathematics teaching time.
Example 1
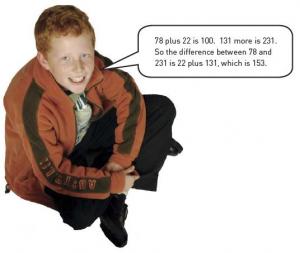
Mitchell had 231 toy sports cars. He sold 78 of them.
How many cars did he have left?
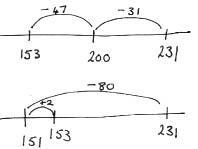
The student solves the problem by using an efficient strategy that involves mental calculation and place value understanding. They may draw on the inverse relationship of addition and subtraction, as illustrated in the speech bubble below. Use of recording is acceptable. If the student uses a vertical algorithm to solve the problem, they must explain the place value partitioning involved.
Source: GloSS Assessment K, task 6.
Example 2
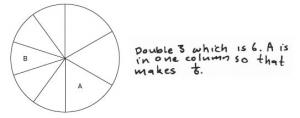
- What fractions of the whole birthday cake are pieces A and B? Explain your answer.
You have 60 jelly beans to decorate the top of the cake. If the jelly beans are spread evenly, how many of them will be on 4/10 of the cake?
The student uses either rotational symmetry, mapping how many of A or B will fit into a full turn, or multiplication to correctly name the fractions (for example, 'B is 1/5 of 1/2 , so it is 1/10'). They use division and multiplication to find the number of jelly beans on four-tenths of the cake (for example, '60 ÷ 10 = 6 jelly beans on 1/10 , 4 x 6 = 24 jelly beans').
Example 3
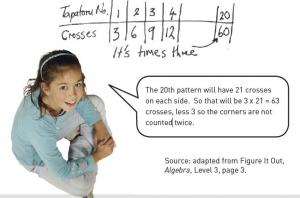
This is how the tapatoru pattern grows.
How many crosses will be in the 20th tapatoru pattern? Show how you worked out your answer.
The student uses repeated addition or a multiplication rule in conjunction with a recording strategy. Alternatively, they might use spatial features of the pattern to solve the problem (for example, by noting there’s an extra cross on each side as the pattern grows).
Return to top
Geometry and measurement
In contexts that require them to solve problems or model situations, students will be able to:
- measure time and the attributes of objects, choosing appropriate standard units
- use arrays to find the areas of rectangles and the volumes of cuboids, given whole-number dimensions
- sort two- and three-dimensional shapes (including prisms), considering given properties simultaneously and justifying the decisions made
- represent and describe the results of reflection, rotation, and translation on shapes or patterns
- identify nets for rectangular prisms
- draw or make objects, given their plan, front, and side views
- describe locations and give directions, using grid references, turns, and points of the compass.
Example 4
Show the student the following illustration. Explain that they have to answer the question without physically cutting or folding the paper.
How many of these nets will fold up to make the box? Which ones are they?
The student correctly identifies that three nets – B, D, and E – will fold to make the cuboid model (a rectangular prism). They understand that the model must have four rectangular faces and two square faces, and they can visualise whether the faces overlap when folded and how the connected faces form parts of the model.
Source: adapted from NEMP’s 2005 report on mathematics, p. 46.
Example 5
Provide the student with interlocking cubes and the following illustration.
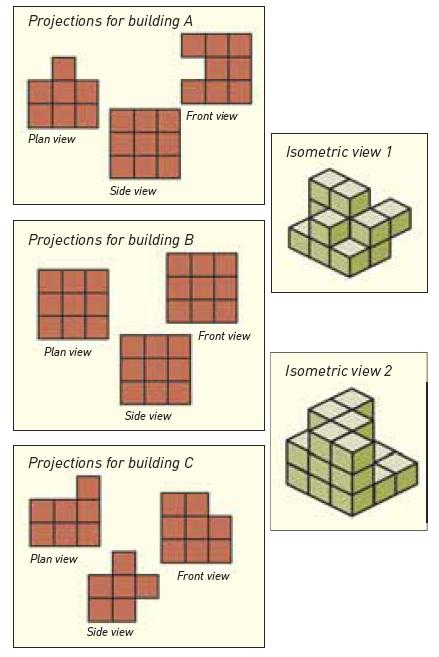
Here are drawings for three buildings. The projections (plan, front, and side views) and isometric views have been mixed up, and one of the isometric drawings is missing.
Match the projections with the isometric views for two of the buildings.
Then use the projections of the third building to assemble it, using interlocking cubes. If you can, draw an isometric view of this building.
The student correctly matches the projections and isometric views for two buildings (building B with isometric view 2; building C with isometric view 1). They then accurately assemble a model of a building that agrees with the projections for building A. If they draw an accurate isometric view of their building, they exceed the expectation.
Source: adapted from Figure it 0ut – Geometry, Levels 3–4, p. 15.
Return to top
Statistics
In contexts that require them to solve problems or model situations, students will be able to:
-
investigate summary and comparison questions by using the statistical enquiry cycle:
- gather or access multivariate category and whole-number data
- sort data into categories or intervals, display it in different ways, and identify patterns
- interpret results in context, accepting that samples vary
- order the likelihoods of outcomes for situations involving chance, considering experimental results and models of all possible outcomes.
Example 6
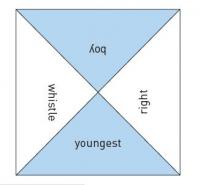
Have each student in the class create a data card with answers to the following questions:
- Are you a boy or a girl?
- Can you whistle?
- Are you the oldest, the youngest, the only, or a middle child in your family?
- Which hand do you usually write with?
Photocopy all the data cards onto A4 paper. Organise the students into pairs, hand out a set of data cards to each pair, and have them cut out all the data cards.
Suggest some different types of questions that could be answered from the data – for example, summary questions like 'Can more people whistle than can’t whistle?' or comparison questions like 'Are more boys or girls left-handed?'
Sort the class data to find the answers to your questions and display the results using graphs so that your classmates can clearly see the answers.
The student asks summary and comparison questions that can be answered using the information provided by the data cards.
They sort and present the data in ways that clearly answer their questions and communicate their findings. To highlight differences, they use pictographs or bar graphs (made from the data cards). To highlight proportions, they might use strip graphs or pie charts.
Source: NZ maths
Example 7
When you toss two coins together, you could get these results:
Toss two coins 24 times.
Each time you toss, put a new counter on a graph to show what you got, like this:
What does the graph show?
Draw a diagram to explain why this happens.
The student’s results will almost certainly suggest that the likelihood of heads-heads or tails-tails is less than that of one head and one tail. To explain their results, they should develop a model of all possible outcomes. Suitable models include:
From the model, they should explain that there is only one way of getting heads-heads or tails-tails but two ways of getting one head and one tail. If the student expresses the likelihoods as fractions, they exceed the expectation.
Source: adapted from Figure it out – Statistics, levels 2–3, p. 22.
Return to top


