By the end of year 4
Number and algebra | Geometry and measurement | Statistics
The following problems and descriptions of student thinking exemplify what is required to meet this standard.
Number and algebra
In contexts that require them to solve problems or model situations, students will be able to:
-
apply basic addition and subtraction facts, simple multiplication facts, and knowledge of place value and symmetry to:
- combine or partition whole numbers
- find fractions of sets, shapes, and quantities
- create, continue, and give the rule for sequential patterns with two variables
- create and continue spatial patterns and number patterns based on repeated addition or subtraction.
During this school year, 'number' should be the focus of 60–80 percent of mathematics teaching time.
Example 1
Imagine you have 37 lollies and you eat 9 of them.
How many lollies would you have left?
The student gets to the answer 28 by mentally partitioning numbers (for example, 9 = 7 + 2 in the first calculation) and by using tidy numbers (for example, 10 in the second calculation).
Source: Numeracy Development Projects. (2008). Book 2: The diagnostic interview, p. 8.
Example 2
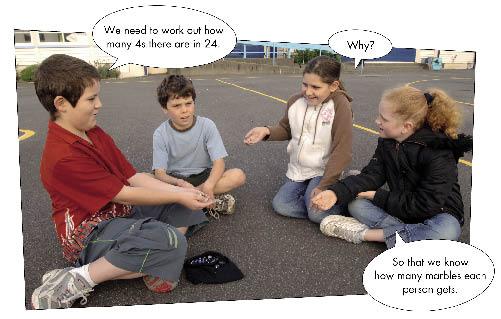
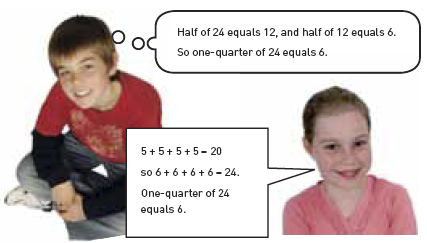
If there are 24 marbles in the bag, how many should each student get?
The student applies their knowledge of symmetry or number facts to partition the set of 24 – for example, by using repeated halving or by using trial and improvement with addition facts.
If the student knows or derives the fact 4 x 6 = 24, they exceed the expectation.
Source: Figure it out – multiplicative thinking, levels 2–3, p. 4.
Example 3
Here is a 3-section matchstick fence.
How many matchsticks would it take to make an 8-section fence?
The student continues the number pattern by using repeated addition, possibly in conjunction with written recording.
If the student draws an 8-section fence and then counts the matchsticks, they do not meet the expectation. Using a multiplicative strategy (for example, (7 x 3) + 4 = 25 or (8 x 3) + 1 = 25) exceeds the expectation.
Source: adapted from Figure it out – algebra, level 3, p. 2.
Return to top
Geometry and measurement
In contexts that require them to solve problems or model situations, students will be able to:
- measure the lengths, areas, volumes or capacities, weights, and temperatures of objects and the duration of events, reading scales to the nearest whole number and applying addition, subtraction, and simple multiplication to standard units
- sort objects and two- and three-dimensional shapes by two features simultaneously
- represent and describe the symmetries of a shape
- create nets for cubes
- describe personal locations and give directions, using simple maps.
Example 4
Give the student the 3 items shown and the torn measuring tape.
Measure the lengths of the bookmark, snake, and ribbon, using the tape measure.
The piece of measuring tape has been torn, but it can still be used for measuring.
The student understands that any point on a whole-number scale can be used as an arbitrary zero. They calculate the difference between 2 points on the measuring tape to find the length of an item, giving the correct number and unit of measurement (for example, 13 cm).
The student must provide an accurate measurement for the length of the ribbon, which is longer than the tape measure. They might take 2 measurements and add the results, or they might fold the ribbon in 2 and double the measurement of that length.
Source: NEMP’s 2005 report on mathematics, p. 40.
Example 5
Give the student the diagram and attribute blocks as per the illustration.
Put all the yellow blocks on Yellow Street.
Put all the big blocks on Big Lane
Which blocks should go in the intersection?
The student simultaneously sorts the blocks by 2 features, size and colour, in order to place the blocks that are both big and yellow in the intersection.
Example 6
Give the student cards with the letters shown below on them.
The letter C has one line of reflective symmetry.
The letter S has half-turn symmetry.
What reflective and turn symmetry do these letters have?
The student identifies the symmetries of each letter as follows:
- H has two lines of reflective symmetry (vertical and horizontal) and half-turn symmetry.
- R has neither reflective nor turn symmetry.
- Z has half-turn symmetry.
Return to top
Statistics
In contexts that require them to solve problems or model situations, students will be able to:
-
investigate questions by using the statistical enquiry cycle independently:
- gather and display category and simple whole-number data
- interpret displays in context
- compare and explain the likelihoods of outcomes for a simple situation involving chance, acknowledging uncertainty.
Example 7
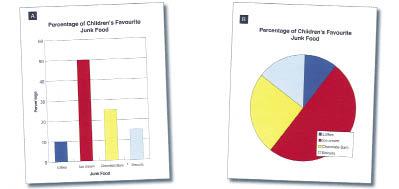
Here are 2 graphs showing information on a group of children’s favourite junk foods.
- What percentage of children said biscuits were their favourite junk food? Which graph did you use to work this out? Why did you use that graph?
- Which junk food did half the children say was their favourite junk food? Which graph did you use to work this out? Why did you use that graph?
The student answers questions 1 and 2 correctly by reading from one of the graphs. They justify their choice of graph by explaining how it provides the required information.
For question 1, they will use the bar graph, which gives number information. The pie chart shows proportions and is therefore the easier display to use in answering question 2. However, the student may also use the bar graph, noting that 50 percent is the same as a half.
Source: adapted from NEMP’s 2007 report on graphs, tables, and maps, p. 17.
Example 8
Ask the student to play the game ‘Will your parents let you?’ Give them 3 different-coloured dice with different mixes of yes and no faces. The red dice has 5 yes faces and 1 no face, blue has 3 yes faces and 3 no faces, and green has 1 yes face and 5 no faces.
Show the student a number of coloured cards with illustrated scenarios, as in the following examples.
The red cards show scenarios that parents are likely to say yes to; blue cards show scenarios that parents may or may not agree to; and green cards show scenarios that are unlikely to be allowed.
The student chooses one card at a time. They roll a red dice if they have chosen a red card, a blue dice if they chose a blue card, and a green dice after choosing a green card. Once the dice gives them an answer, they put that card in a yes pile or a no pile.
- What do you notice about the colours of the cards in the yes pile and in the no pile? Can you explain this by looking at the 3 dice?
- Imagine there’s something you really want to do. Which dice would you use to find out whether you can do it or not? Will you get a yes when you roll that dice?
The student should notice that the yes pile contains lots of red cards and the no pile contains lots of green cards. They should be able to explain that this is because the red dice has more yes faces than the green one.
In answer to question 2, the student should reply that the red dice would be best because it gives the best chance of getting a yes. They should acknowledge that a no answer is still possible with the red dice, even though a yes answer is more likely.
Source: V. Wright (1997). Topic based mathematics 1. Hamilton: Mathematics Advisory Service.
Published on: 15 Oct 2009
Return to top