After three years at school
Number and algebra | Geometry and measurement | Statistics
The following problems and descriptions of student thinking exemplify what is required to meet this standard.
Number and algebra
In contexts that require them to solve problems or model situations, students will be able to:
-
apply basic addition facts and knowledge of place value and symmetry to:
- combine or partition whole numbers
- find fractions of sets, shapes, and quantities
- create and continue sequential patterns with one or two variables by identifying the unit of repeat
- continue spatial patterns and number patterns based on simple addition or subtraction.
During this school year, 'number' should be the focus of 60–80 percent of mathematics teaching time.
Example 1
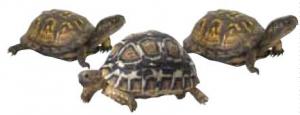
You have 18 turtles, and you buy another 8 turtles from the pet shop.
How many turtles do you have now?
The student could use 'making tens' (for example, '18 + 2 = 20; that leaves 6 remaining from the 8; 20 + 6 = 26') or apply their knowledge of doubles and place value (for example, '18 = 10 + 8; first add the 8, then the 10; 8 + 8 = 16, 16 + 10 = 26').
If the student responds very quickly because they know the fact 18 + 8 = 26, this also meets the expectation. If the student counts on, they do not meet the expectation.
Example 2
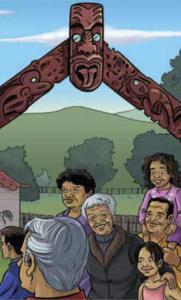
87 people are at the pōwhiri (welcome). 30 of the people are tangata whenua (locals). The rest of the people are manuhiri (visitors).
How many manuhiri are there?
The student uses place value knowledge, combined with either addition or subtraction, to solve the problem. They may add on (30 + 50 = 80, 80 + 7 = 87) or subtract (80 – 30 = 50, so 87 – 30 = 57). If they use counting up or back in tens (for example, 40, 50, 60, 70, 80, 87), they do not meet the expectation.
If they use a pencil and paper method to subtract 0 from 7 and 3 from 8, this doesn’t necessarily demonstrate enough understanding of place value to meet the expectation. If they use this method, they must show that they understand the place value of the digits and that they are not treating them all as ones.
Example 3
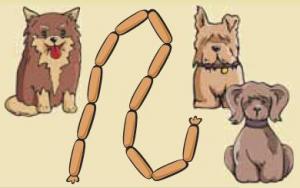
Here is a string of 12 sausages to feed 3 hungry dogs.
Each dog should get the same number of sausages. How many will each dog get?
The student applies basic addition facts to share out the sausages equally between the dogs. Their thinking could be based on doubles or equal dealing – for example, 5 + 5 + 2 = 12, so 4 + 4 + 4 = 12 (redistributing 1 from each 5), or 6 + 6 = 12, so 4 + 4 + 4 = 12, or 2 + 2 + 2 = 6, so 4 + 4 + 4 = 12.
If the student solves the problem by one-to-one equal sharing, they do not meet the expectation. If they solve the problem using multiplication facts (3 x 4 = 12 or 12 ÷ 3 = 4), they exceed the expectation.
Example 4
Show the student the illustration below. What shape goes on the number 14 in this pattern? What colour will it be?
The student identifies the two variables (shape and colour) in the pattern. They might look at the variables separately and identify the unit of repeat for each ('Yellow, blue, red' and 'Triangle, circle'). Or they might look at the variables together to identify the complete unit of repeat ('Yellow triangle, blue circle, red triangle, yellow circle, blue triangle, red circle').
They continue the pattern until they identify that the shape on number 14 is a blue circle. If the student recognises that multiples of 2 in the pattern are circles and multiples of 3 are red and uses this information to solve the problem, they exceed the expectation.
Return to top
Geometry and measurement
In contexts that require them to solve problems or model situations, students will be able to:
- measure the lengths, areas, volumes or capacities, and weights of objects and the duration of events, using linear whole-number scales and applying basic addition facts to standard units
- sort objects and two- and three-dimensional shapes by their features, identifying categories within categories
- represent reflections, translations, and rotations by creating and describing patterns
- describe personal locations and give directions, using whole-number measures and half- or quarter-turns.
Example 5
Give the student 3 pencils of different lengths and a ruler.
Use the ruler to find the length of each pencil.
How much longer is the green pencil than the red pencil?
The student correctly measures the length of each pencil to the nearest centimetre: they align the end of the pencil with zero on the scale and read off the measure correctly.
They apply basic addition facts to find the difference in length between the green and red pencils (for example, for 12 centimetres and 9 centimetres: '3 centimetres, because 10 + 2 = 12, so 9 + 3 = 12'; or '3 centimetres, because I know 9 + 3 = 12').
Example 6
Give the student a circle of paper. Fold this circle into 8 equal-sized pieces.
The student uses reflective symmetry through repeated halving to partition the circle into eighths.
Example 7
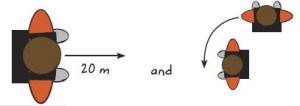
Give the student a metre ruler or tape measure and show them the illustrations below.
Write a set of instructions to explain to a visitor how to get from the library door to our classroom door. Make sure you include any right or left turns and distances in metres. You can use pictures to give the instructions, like this:
You can also use pictures or descriptions of objects such as buildings or trees.
The student provides a set of instructions that are accurate enough for a visitor to find their way to the classroom door from the library. If the student specifies compass directions or clockwise or anti-clockwise turns, they exceed the expectation.
Return to top
Statistics
In contexts that require them to solve problems or model situations, students will be able to:
-
investigate questions by using the statistical enquiry cycle (with support):
- gather and display category and simple whole-number data
- interpret displays in context
- compare and explain the likelihoods of outcomes for a simple situation involving chance.
Example 8
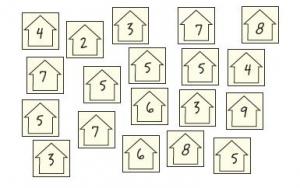
Each student writes the number of people that usually live in their house on a square of paper or a sticker.
How many people live in the houses of students in our class?
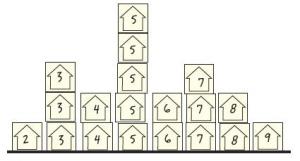
Arrange the squares to find out.
What can you say about your arrangement?
The student sorts the whole-number data into groups. They may display the data in enclosed groupings or in a more organised display, such as a bar graph.
The student makes a statement about the number of people living in students’ houses, based on their sorting of the data, for example, 'There are lots of different numbers of people living in houses, from 2 to 9' or '5 is the most common number of people'.
Example 9
Let the student watch as you put 3 blue cubes, 2 yellow cubes, and a red cube into a paper bag.
Put your hand in the bag and take out a cube, but don’t look at it.
What colour is the cube most likely to be? What colour is it least likely to be?
Explain why.
The student classifies the probability of getting each colour ('Blue is most likely, and red is least likely'). They discuss the numbers and colours of cubes to explain their answer (for example, 'There are 3 blue cubes and only 1 red cube').
If the student gives the probabilities as fractions (for example, 'There is a one-half chance of blue'), they exceed the expectation. If they explain the likelihoods without reference to the number of cubes (for example, 'Yellow is my lucky colour' or 'I always get red'), they do not meet the expectation.
Published on: 15 Oct 2009
Return to top


