Year 10 students undertake a statistical enquiry cycle which gets them discussing safe speeds.
Arts students design and produce posters with their own safety messages aimed at the iPod generation.
Secondary students explore the journeys they make as passengers and write persuasively about the need for safe decisions.
Students get hands-on when learning about forces in the context of safe road travel.
Mathematics and statistics: Investigating vehicle stopping distances
Year 10 students undertake a statistical enquiry cycle which gets them discussing safe speeds.
Interviewees: Wellington College teachers Sarah Howell, unit writer, and Martin Vaughan, trialler.
When it comes to road safety material, most teachers would be likely to say, “Oh, that’s an interesting unit or activity but I can’t fit it in.” We wanted to design an approach that was core to teachers’ work in mathematics but also led to valuable social outcomes like students having a deeper understanding about why the speed you travel is important, and being more aware of the behaviours needed to keep safe on roads.
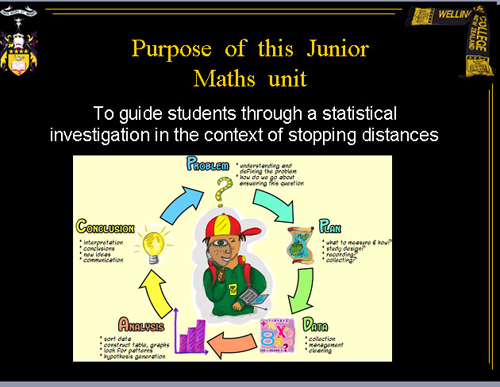
We chose to focus on the statistical enquiry cycle because it is required in the maths curriculum and it is also relatively new for teachers. We thought a resource that genuinely helps teachers to implement some new approaches required in the statistics curriculum would be welcome.
We were true to the statistical enquiry cycle in the maths curriculum and at the same time we addressed wider curriculum objectives about being safe on the roads and understanding where the issues are. We started with data that we wanted to investigate. We didn’t start with a road safety message; we didn’t tell them “the faster you go the bigger the mess”.
Select this link if you can’t view or read this image.
An advertisement on TV or a lecture from teachers or parents is unlikely to make much difference to teenagers. We were looking for a teaching and learning process that was likely to spark a chain of thinking and action.
If you contrive a context, students will see through it. Contexts need to be relevant and real. We focused on the big idea of stopping distances. This included reaction distance – the time it takes for a driver to perceive that they need to stop and the amount of time it takes for them to react to the situation – and braking distance – vehicle reaction time and vehicle braking capability.
It was relevant and engaging for students. They all travel. There was a hook for everyone. They could all see meaning. Some students were more interested in mechanical issues, for example, the brakes, the condition of the tyres and the effects of lowered suspension; some were more interested in how distractions like chattering influenced stopping distance; some were interested in the impact of weather and the construction of roads.
Students carried out different investigations, then these fed into class discussions – so what each group knew and found out was shared, and we added our knowledge as teachers too.
We were surprised about how much the students really thought about the context, and we were surprised at the depth of their insights. They came up with things we hadn’t thought of. They knew the difference in the stopping abilities of older and newer model cars and cars with new and old tyres, for example.
We looked at speeds in local suburbs and better understood why the speed in some areas had been lowered to 30km per hour. The students made their own meaning about why we have two-second and four-second rules.
We developed an assessment rubric for the in-class investigation and included a self-assessment component to allow students to reflect on their own learning. Most students were not surprised about stopping distances, but they were surprised about the extent of the difference a small amount of extra speed can make.
We looked at the application of what they had learnt. We asked who would be interested in the results. Students suggested their parents, their peers who were learning to drive, and the local council.
Telling students things, doesn’t work. It makes no difference to their behaviour. Road safety shouldn’t be taught by being preachy. Students can rail at being told something – like lower your speed – but they can’t rail at asking questions and investigating data themselves, or at sharing conclusions and being asked to think about how we can improve on these statistics. Looking at data and considering what it means often leads to a change in knowledge, behaviour or attitudes because when students discover things for themselves, those things have more chance of sticking.
Although we teachers knew about stopping distances, we are more conscious of the difference in stopping distance at 40 and 50km per hour now and it’s made us more aware drivers.
Now we are working on a maths unit that looks at angles and lapses in concentration. If you start veering at a small angle because of a distraction or concentration lapse, how long does it take to cross the centre line?
Through this unit of work we have added width to the informed decision-making our students are capable of. In the future it would be great to be able to access raw data from NZTA – data that is authentic and student friendly. Then our students could become true partners in analysing data, thoughtful problem solving and decision making, and making recommendations that might help create safer journeys for the wider community.


