By the end of year 8
Number and algebra | Geometry and measurement | Statistics
The following problems and descriptions of student thinking exemplify what is required to meet this standard.
Number and algebra
In contexts that require them to solve problems or model situations, students will be able to:
- apply multiplicative strategies flexibly to whole numbers, ratios, and equivalent fractions (including decimals and percentages)
- use multiplication and division as inverse operations on whole numbers
- apply additive strategies flexibly to decimals and integers
-
find and represent relationships in spatial and number patterns, using:
- tables and graphs
- equations for linear relationships
- recursive rules for non-linear relationships
- apply inverse operations to simple linear relationships.
During this school year, 'number' should be the focus of 40–60 percent of mathematics teaching time.
Example 1
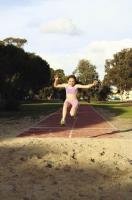
Mani competed in the hop, step, and jump at the athletics sports.
Her jump was 2.65 metres, and her step was 1.96 metres.
The total of her triple jump was 5.5 metres.
How long was her hop?
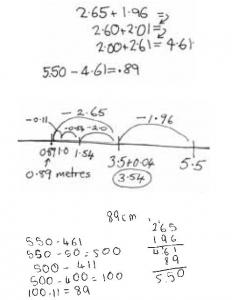
The student applies their knowledge of decimal place value to correctly calculate the answer. They use a combination of mental and written strategies, which may include equations, vertical algorithms, or empty number lines.
Example 2
Andre has ordered 201 tennis balls. They are sold in cans of 3 balls.
How many cans should he receive?
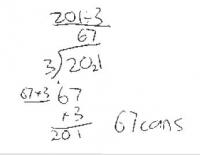
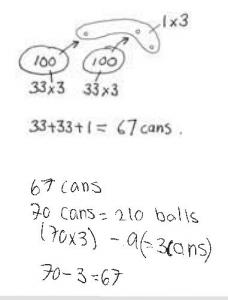
The student gets the correct answer of 67 and, when explaining their strategy, demonstrates understanding of division and place value. Their strategy might involve partitioning numbers into hundreds, tens, and ones, using tidy numbers (for example, 210) and compensating, or using divisibility rules (for example, 'There are 33 threes in 100 with one left over').
Source: adapted from GloSS, Assessment I, task 10.
Example 3
With 26 matchsticks, you can make 4 fish in this pattern.
How many fish can you make with 140 matchsticks?
Write an equation that gives the rule for the number of matchsticks you need for a given number of fish.
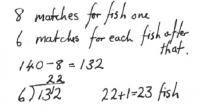
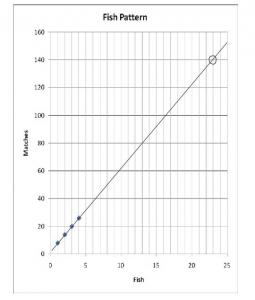
The student finds a linear relationship between the number of fish and the number of matchsticks, and they write an equation that expresses that relationship (for example, y = 6x + 2). To solve the problem, they use a graph or apply inverse operations to their rule or equation, for example, 'undoing' or 'reversing' the 'six times the number of fish plus two' rule (140 – 2 = 138, 138 ÷ 6 = 23). If they simply continue a table to solve the problem (1 fish, 8 matches; 2 fish, 14 matches; 3 fish, 20 matches ...), they do not meet the expectation.
Return to top
Geometry and measurement
In contexts that require them to solve problems or model situations, students will be able to:
- use metric and other standard measures
- make simple conversions between units, using decimals
- use side or edge lengths to find the perimeters and areas of rectangles, parallelograms, and triangles and the volumes of cuboids
- sort two and three-dimensional shapes into classes, considering the relationships between the classes and justifying the decisions made
- identify and describe the features of shapes or patterns that change or do not change under transformation
- create or identify nets for rectangular prisms and other simple solids, given particular requirements
- draw or make objects, given their plan, front, and side views or their perspective views
- describe locations and give directions, using scales, bearings, and co-ordinates.
Example 4
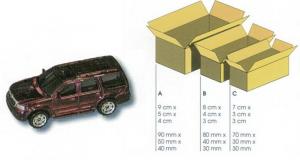
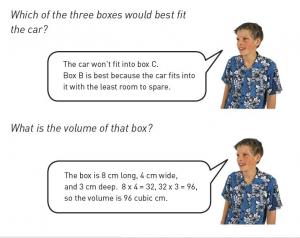
Give the student a ruler, a toy car to measure, and the illustration of boxes shown above.
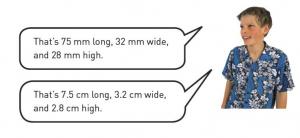
Use the ruler to measure as accurately as possible how long, how wide, and how high this car is. Give your answer firstly in millimetres and then in centimetres.
Using the ruler, the student accurately measures the length, width, and height of the toy car to the nearest millimetre, and they are able to convert between millimetres and centimetres. They choose the most suitable box – that is, the one with dimensions that exceed the dimensions of the car by the least possible amount.
Source: adapted from NEMP’s 2005 report on mathematics, p. 40.
Example 5
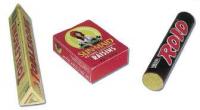
Is there a family that all three of these solid shapes belong to? Why?
Is there another family of solid shapes that the Rolo packet could belong to?
The student states that all three solids are prisms. They explain that a prism has a uniform cross-section and that this gives the prism its name (for example, a 'triangular prism').
There is debate about the definition of a prism and whether a cylinder is a prism. If the student rejects the cylinder as a prism, explaining that it does not have rectangular faces like other prisms, they still meet the expectation.
In answer to the second question, the student could place the cylinder in the family of curved solids that includes spheres and cones. Any other plausible possibility for an alternative family of solids is also acceptable (for example, solids with circular faces).
Source: adapted from NEMP’s 2005 report on mathematics, p. 44.
Example 6
Provide the student with a selection of shapes including squares, rectangles, diamonds, regular hexagons, regular octagons, circles, and equilateral, right-angled, and scalene triangles.
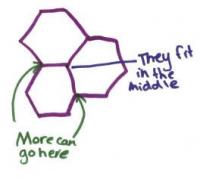
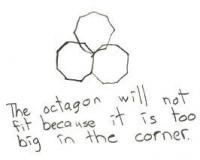
Which of these shapes will tessellate? Why?
The student explains that shapes that tessellate must fit together around a point and that therefore, for a regular shape, its interior angle must divide evenly into 360. For each shape, they refer to an angular measure to justify their conclusion as to whether it will tessellate or not (for example, 'An equilateral triangle tessellates because 6 x 60° = 360°, so six triangles will surround a point').
Source: The New Zealand Curriculum exemplars – Geometry: Tessellations, level 4.
Return to top
Statistics
In contexts that require them to solve problems or model situations, students will be able to:
-
investigate summary, comparison, and relationship questions by using the statistical enquiry cycle:
- gather or access multivariate category, measurement, and time-series data
- sort data and display it in multiple ways, identifying patterns, variations, relationships, and trends and using ideas about middle and spread where appropriate
- interpret results in context, identifying factors that produce uncertainty
- express as fractions the likelihoods of outcomes for situations involving chance, checking for consistency between experimental results and models of all possible outcomes.
Example 7
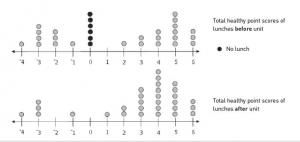
Jane’s class was doing a unit on healthy eating. Jane wanted to see if the unit would make any difference to her classmates’ eating habits, so she developed a scale to measure the healthiness of the lunches they were eating.
She applied the scale before and after the unit and created two dot plots to display the results.
Jane concluded that because of the unit, her classmates were now eating healthily. Do you agree? Why or why not?
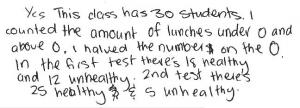
The student uses data from the graphs to support and/or argue against Jane’s conclusion. For example, they should identify that more students are now eating healthier lunches and that all students are now bringing or buying a lunch. With prompting, they should be able to identify that although the spread of unhealthy to healthy lunches has not changed, the clustering of lunch scores has shifted to more above zero than below, and therefore the 'middle healthiness' has increased.
The student should point out that Jane’s conclusion that 'her classmates were now eating healthily' is not supported by the data, which shows that a small group of students continue to eat unhealthy lunches. They should also recognise that without additional data (such as a larger sample across different days or information from interviews), the improvement in lunch healthiness is not necessarily due to the class unit. For example, the tuck shop may have changed its menu while the class was doing the unit.
Source: Second tier support material for the revised New Zealand Curriculum.
Example 8
This is a game you might use at the school gala.
Put 2 red balls and 2 blue balls in a bucket. Without looking, a player takes out 2 balls. If the balls are the same colour, they win. If the balls are different, they lose.
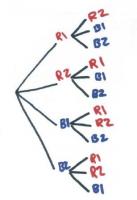
Carry out an experiment by playing 30 games and recording how often the player wins and loses. Draw a diagram to show all the possible outcomes when you draw 2 balls from the bucket. Does this help explain your results? How?
If you played 30 more games, would the results be the same as or different from your first experiment? If they would be different, how?
The student plays 30 games and organises their results systematically, for example, by using a table or tally chart. They notice that there are more losses than wins. (The results will generally be around 10 wins and 20 losses.)
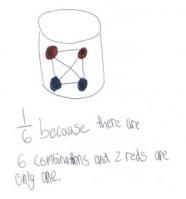
The student creates a model of all possible outcomes, for example, a network or tree diagram.
From the model, the student concludes that the chances of winning and losing are one-third and two-thirds respectively. They accept that their results may not exactly reflect these likelihoods (for example, 12 wins from 30 games is slightly more than one-third).
The student understands that the first experiment does not influence the second. They explain that the results are likely to be around 10 wins and 20 losses but unlikely to be identical to the results from the first experiment – that is, they accept the variability and independence of samples. (In this case, the sample consists of 30 games.)
Source: adapted from The New Zealand Curriculum exemplars – Statistics: Probability, level 4.
Published on: 15 Oct 2009
Return to top


