After two years at school
Number and algebra | Geometry and measurement | Statistics
The following problems and descriptions of student thinking exemplify what is required to meet this standard.
Number and algebra
In contexts that require them to solve problems or model situations, students will be able to:
- apply counting-on, counting-back, skip-counting, and simple grouping strategies to combine or partition whole numbers
- use equal sharing and symmetry to find fractions of sets, shapes, and quantities
- create and continue sequential patterns by identifying the unit of repeat
- continue number patterns based on ones, twos, fives, and tens.
During this school year, 'number' should be the focus of 60–80 percent of mathematics teaching time.
Example 1
Imagine you have 9 stamps and 12 letters.
How many more stamps would you need to post all the letters?
The student gets the correct answer of 3 stamps by counting on 10, 11, 12 and tracking the count of 3. Alternatively, they may count back 11, 10, 9, tracking the count of 3.
If the student successfully uses a part–whole strategy, they exceed the expectation (for example '9 stamps and 1 more is 10, and that leaves 2 more stamps, which is 12', or '12 is 4 threes, and 9 is only 3 threes, so I need 3 more stamps').
Example 2
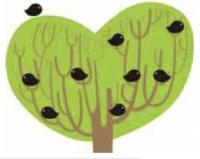
Imagine there are 49 birds sitting in the tree.
Another 4 birds come along.
How many birds are in the tree now?
The student gets the correct answer of 53 birds by counting on 50, 51, 52, 53 and tracking the count of 4. They may track the count by imaging or using substitute materials, including fingers.
If the student successfully uses a part–whole strategy (for example '49 and 1 is 50; that leaves 3 more birds, so there are 53 birds in the tree'), they exceed the expectation.
Example 3
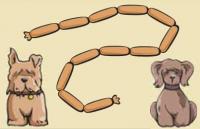
Here is a string of 12 sausages to feed 2 hungry dogs.
Each dog should get the same number of sausages. How many will each dog get?
The student uses equal sharing to distribute the sausages between the dogs. This might involve skip-counting ('2 sausages makes 1 each, 4 sausages makes 2 each ... 12 sausages makes 6 each') while tracking the count mentally or with fingers, or it might involve halving, that is, dividing 12 into 6 and 6. (Note that 6 and 6 is a symmetrical partitioning of 12.)
Example 4
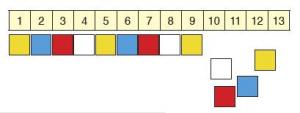
Show the student a number strip with coloured cubes lined up along it, as in the diagram below. Provide extra coloured cubes.
What colour cube goes on the number 13 in this pattern?
The student identifies the unit of repeat (yellow, blue, red, white) and continues the pattern one cube at a time until they identify a yellow cube on 13. If the student notices that multiples of 4 have a white cube and therefore 13 has a yellow cube, they exceed the expectation.
Return to top
Geometry and measurement
In contexts that require them to solve problems or model situations, students will be able to:
- compare the lengths, areas, volumes or capacities, and weights of objects and the durations of events, using self-chosen units of measurement
- sort objects and shapes by different features and describe the features, using mathematical language
- represent reflections and translations by creating and describing patterns
- describe personal locations and give directions, using steps and half- or quarter-turns.
Example 5
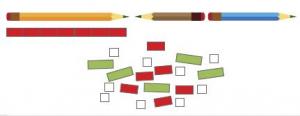
Place 3 pencils of different lengths end-on-end with gaps between them, as shown. Give the student a collection of white, red, and light green Cuisenaire™ rods.
Place rods underneath each pencil to show how long it is.
Without moving the pencils, can you tell me how much longer the orange pencil is than the blue pencil?
The student places the same-coloured rods, with no gaps or overlaps, from one end to the other of each pencil.
They count on or back to find the difference in length without needing to directly align the pencils. For example, if the orange pencil is 7 red rods long and the blue pencil is 4 red rods long, the student counts 5, 6, 7 or uses 4 + 3 = 7 to work out that the difference is 3 red rods.
If the student uses different-coloured rods and shows that they understand that, for example, 2 white rods are the same length as 1 red rod, they exceed the expectation.
Example 6
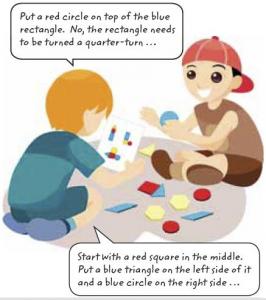
The students work in pairs.
One student has a picture of a group of attribute blocks laid out in a certain way. The other student has a set of actual attribute blocks.
Without showing their partner the picture or pointing to the blocks, the first student describes to the second how to arrange the group of blocks so that it matches the picture, and the second student follows their instructions.
The student giving the instructions uses the appropriate positional language and geometric terms for shapes, and they accurately describe colours and turns (half and quarter). The other student is able to assemble the figure correctly with no errors in position or orientation of shapes.
Return to top
Statistics
In contexts that require them to solve problems or model situations, students will be able to:
- investigate questions by using the statistical enquiry cycle (with support), gathering, displaying, and/or identifying similarities and differences in category data
- describe the likelihoods of outcomes for a simple situation involving chance, using everyday language.
Example 7
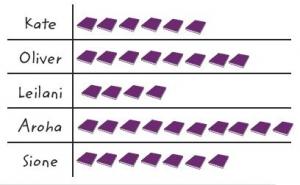
Provide the student with the graph.
It’s readathon week. Five students make this graph to show how many books each of them reads during the first day. Each time they finish reading a book, they add a book to the graph.
- How many books does each student read in the first day?
- How many more books does Aroha read than Leilani?
- Do the girls read more books than the boys?
The student is able to say how many books individual students read (for example, 'Kate reads 6 books. Sione reads 7.').
The student finds the difference between the number of books read by Aroha and Leilani by counting on or back (for example, 'Aroha reads 6 more books than Leilani. I just counted the extra ones.').
To compare the total books read by girls and boys, the student needs to recognise which names are girls’ names and which are boys’. (You may need to help.) They count up the total for both and compare them. If the student uses additive thinking rather than counting, they exceed the expectation (for example, 'The boys read 8 books and 7 books. 8 + 7 = 15 because 7 + 7 = 14'). If the student realises that the comparison is not representative (or fair) because there are 3 girls and only 2 boys, they exceed the expectation.
The student should be able to ask their own comparison questions about the data, for example, 'How many more books does Oliver read than Kate?'
Example 8
Let the student watch as you put 4 blue cubes and 1 yellow cube into a paper bag.
Put your hand in the bag and take out a cube, but don’t look at it.
What colour will it be?
The student identifies the two possible outcomes. If they omit one of them (for example, 'It will be blue because there are more of them') or identify an outcome that is not possible (for example, 'It will be green because that is my favourite colour'), they do not meet the expectation.
If the student states that getting a blue cube is more likely than a yellow cube because there are more blue cubes than yellow cubes in the bag, they exceed the expectation.
Published on: 15 Oct 2009
Return to top


