By the end of year 5
Number and algebra | Geometry and measurement | Statistics
The following problems and descriptions of student thinking exemplify what is required to meet this standard.
Number and algebra
In contexts that require them to solve problems or model situations, students will be able to:
-
apply additive and simple multiplicative strategies and knowledge of symmetry to:
- combine or partition whole numbers
- find fractions of sets, shapes, and quantities
- create, continue, and predict further members of sequential patterns with two variables
- describe spatial and number patterns, using rules that involve spatial features, repeated addition or subtraction, and simple multiplication.
During this school year, 'number' should be the focus of 50–70 percent of mathematics teaching time.
Example 1
There are 53 people on the bus.
26 people get off.
How many people are left on the bus?
The student uses an efficient part–whole strategy for subtraction, such as subtracting in parts (for example, 53 – 6 = 47, 47 – 20 = 27; or 53 – 20 = 33, 33 – 6 = 27) or subtracting a tidy number (for example, 53 – 30 = 23, 23 + 4 = 27).
If they count back or use repeated subtraction (for example, 53 – 10 = 43, 43 – 10 = 33 …), they do not meet the expectation. If they use inverse relationships between subtraction and addition, such as adding on (for example, 26 + 4 = 30, 30 + 23 = 53, 4 + 23 = 27, so 26 + 27 = 53) or doubling (for example, 26 + 26 = 52, so 26 + 27 = 53), they exceed the expectation. If the student uses a written algorithm to solve the problem, they must explain the place value partitioning involved.
Source: NumPA, Numeracy Development Projects, Book 2: The diagnostic interview, p. 8.
Example 2
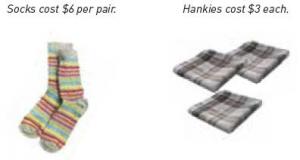
How much does it cost to buy 4 pairs of socks and 8 hankies?
The student will generally use some form of written recording when working through this problem. Solving the problem using only mental calculations is also acceptable.
The student uses multiplication facts and addition to correctly solve the problem. They may do so in any order and may work out the multiplication facts if they do not know them (for example, by calculating 4 x 6 as double 2 x 6 or 8 x 3 as 10 x 3 – 6). The addition should make use of part–whole strategies (for example, 24 + 24 = 40 + 8 = 48).
Vertical algorithms should not be needed for this problem. If the student uses repeated addition (for example, 6 + 6 + 6 + 6 + 3 + 3 …), they do not meet the expectation. If they use only multiplication (for example, ‘4 x 6 = 8 x 3, so the total cost is 8 x 6 = 48’), they exceed the expectation.
Example 3
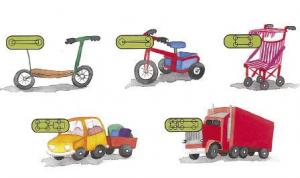
Show the student the following illustration.
Scooters need 2 wheels.
Tricycles need 3 wheels.
Pushchairs need 4 wheels.
Cars with trailers need 6 wheels.
Trucks need 8 wheels.
The factory orders 48 wheels.
How many of each toy can they make with the 48 wheels?
The student uses known multiplication facts or builds up answers with addition and multiplication. For example, to find how many twos are in 48 (for scooters), they may use doubles knowledge (24 + 24 = 48). To find how many threes are in 48 (for tricycles), they may use addition and multiplication (for example, 12 x 3 = 36, so 13 x 3 = 36 + 3 = 39, 14 x 3 = …).
If they use properties of multiplication efficiently, they exceed the expectation (for example, 48 ÷ 3 is the same as 30 ÷ 3 = 10 plus 18 ÷ 3 = 6, so 48 ÷ 3 = 16; or 48 ÷ 6 = 8 (known fact), so 48 ÷ 3 = 16).
Source: Figure it out – Number, levels 2–3, p. 15.
Example 4
Show the student the following patterns.
How many tiles will be in pattern 4? How do you know?
How many tiles will be in pattern 6? Explain how you know.
The student identifies the rule for the pattern – that it is growing by four tiles each time because one tile is added to each arm. They use either addition (for example, 5 + 4 = 9, 9 + 4 = 13) or multiplication (for example, 4 x 3 = 12, 12 + 1 = 13) to find the number of tiles in pattern 4.
To find the number of tiles in pattern 6, they may use repeated addition (for example, 13 + 4 = 17, 17 + 4 = 21) or multiplication (for example, 4 x 5 = 20, 20 + 1 = 21). If they use counting on combined with drawing, they do not meet the expectation.
Return to top
Geometry and measurement
In contexts that require them to solve problems or model situations, students will be able to:
- measure time and the attributes of objects, choosing appropriate standard units and working with them to the nearest tenth
- sort two- and three-dimensional shapes, considering the presence and/or absence of features simultaneously and justifying the decisions made
- represent and describe the results of reflection, rotation, and translation on shapes
- create nets for rectangular prisms
- draw plan, front, and side views of objects
- describe locations and give directions, using grid references and points of the compass.
Example 5
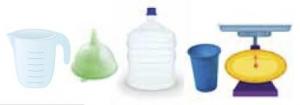
Give the student access to water, a capacity measure (for example, a marked jug), a funnel, a 3 litre bottle, an unmarked 250 milli-litre plastic cup, and kitchen scales.
- Find out how much water the plastic cup holds.
-
Without using the bottle, estimate how many cups you could pour from a:
a) 1 litre bottle b) 3 litre bottle c) 1.5 litre bottle.
- Use the scales to find out the weight of the 3 litre bottle when it is full of water.
- How much would a full 1.5 litre bottle weigh? Use the scales to check your answer.
The student correctly reads the scales on the capacity measure and the kitchen scales to the nearest whole number (for example, 'The full 3 litre bottle weighs 3 kilograms') or the nearest tenth (for example, when weighing a half-full 3 litre bottle). They use their knowledge of place value and multiplication to connect results (for example, 'A 1 litre bottle holds 4 cups because 4 x 250 = 1000 mL' and 'A 3 litre bottle holds 12 cups because 3 x 4 = 12').
If the student uses their knowledge of conversions between units (for example, '1 litre of water weighs 1 kilogram, so 1.5 litres weighs 1.5 kilograms'), they exceed the expectation.
Source: adapted from Figure it out – Measurement, levels 2–3, p. 6.
Example 6
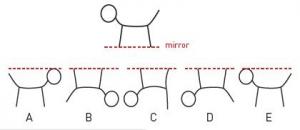
Show the student the following illustration.
Will the drawing look like A, B, C, D, or E when it is reflected in the mirror? Why?
The student correctly identifies D as the answer. They explain their choice by referring to features that change or do not change, for example, ‘The dog has to be upside down’, ‘It has to be facing the same way’, ‘It must still have straight legs and a bent tail’.
Source: adapted from PAT Test 2, Item 31, © NZCER 2007.
Example 7
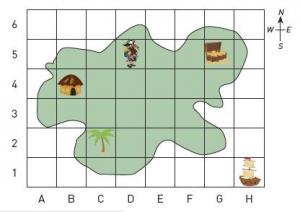
Show the student the following illustration.
What things are at B4 and C2 on the map?
What is the location of the treasure?
The pirate wants to use his compass to get back to his ship. In what direction should he go?
The student correctly names the objects at B4 (a hut) and C2 (a tree) and gives the location of the treasure as G5. They state that the pirate must travel south-east to get to his ship, and they can trace his path.
Source: adapted from PAT Test 2, Item 12, © NZCER 2007.
Statistics
In contexts that require them to solve problems or model situations, students will be able to:
-
investigate summary and comparison questions by using the statistical enquiry cycle:
- gather, display, and identify patterns in category and whole-number data
- interpret results in context
- order the likelihoods of outcomes for simple situations involving chance, experimenting or listing all possible outcomes.
Example 8
Ask each student in the class to measure their height to the nearest centimetre and to record it on a sticker.
Put the stickers onto a board or photocopy them as data cards.
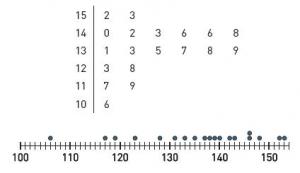
Sort and display the heights of the students in our class. What patterns can you find in the data?
The student sorts the heights from shortest to tallest. They are able to group the measurements into intervals and use displays for comparison, with or without the use of computer technology. For example:
The student makes statements about the data based on the ideas of middle, spread, and clustering, for example, ‘The middle height is about 133 centimetres’, ‘We are between 105 and 155 centimetres tall’, ‘Most people are between 130 and 150 centimetres tall’.
Example 9
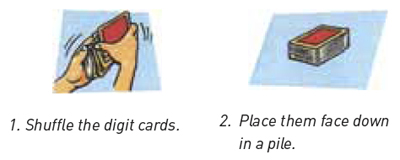
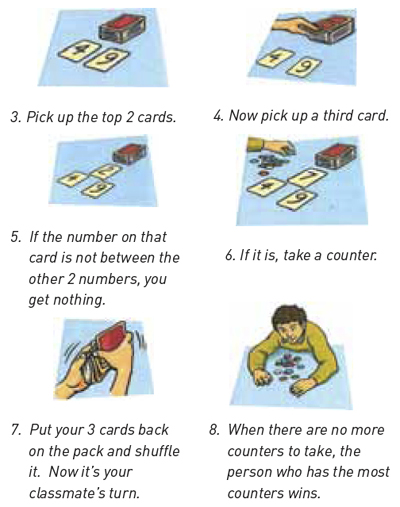
Students play the following game with a pack containing 10 digit cards (0, 1, 2 ... 9).
Give the student these four scenarios and ask them to compare the chances of winning.
The student compares the probabilities of winning in the various scenarios by assessing the likelihood of getting a number between the two that are exposed.
They may list the possibilities: the number 5 for between 4 and 6; 3, 4, 5, 6 for between 2 and 7; and so on. To meet the expectation, the student orders the probabilities correctly, noting that 2–7 and 3–8 have equal likelihood. 4–6 is the least likely to win and 1–9 the most likely.
If the student uses fractions to order the probabilities, they exceed the expectation (for example, 'There is a one-half (4 out of 8) chance of getting a card between 2 and 7').
Source: Figure it out – Statistics (rev.), levels 2–3, p. 24.
Published on: 15 Oct 2009
Return to top


